The project, which cannot be executed statically in a browser, is instead showcased through the images here.

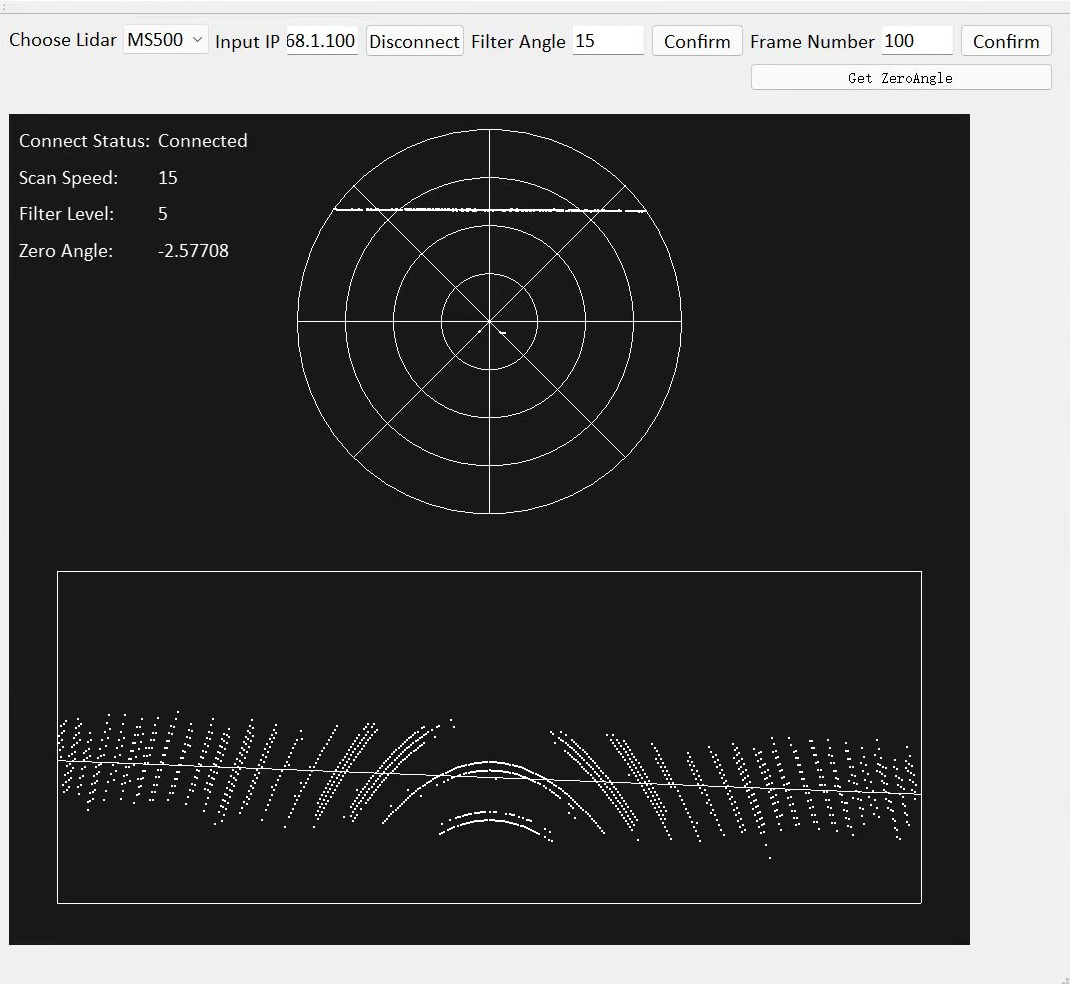
The circle visually represents the point cloud data captured by the lidar, while the rectangle shows an enlarged view of a specific segment of this point cloud. Within the rectangle, a line is drawn to fit the data points, serving as a tool to measure the lidar's zero angle, also known as the azimuth angle.